Plotivy
My latest project developed as a side activity during my PhD.
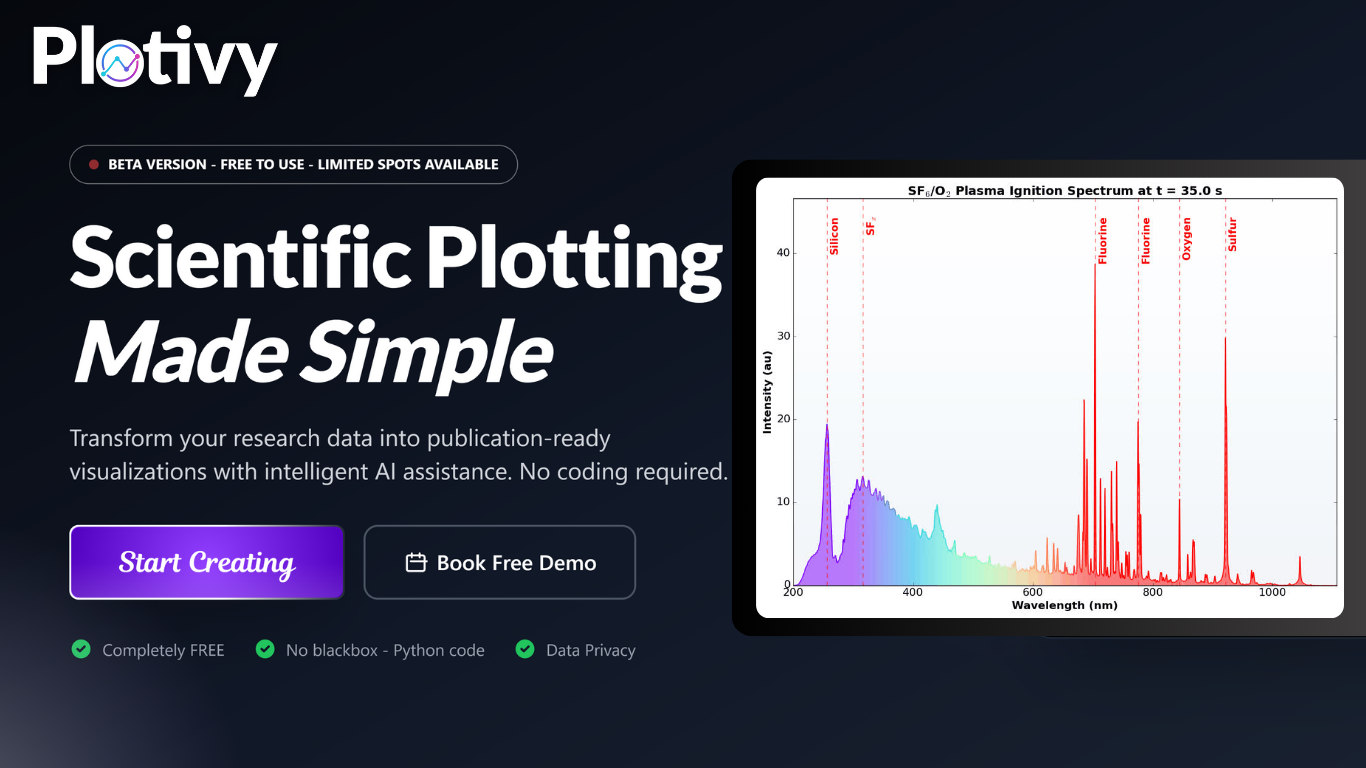
Plotivy is an AI-assisted plotting and data visualization tool designed for scientists and researchers. It helps you create publication-ready plots, perform statistical analysis, design experiments (DOE), and generate reproducible scientific reports from simple text prompts. Whether you're working with raw data, images, or need to analyze micrographs, Plotivy streamlines the process with transparent, editable code and FAIR-compliant workflows.